
Metrics: A Complete Guide to Measure Success
Introduction
Metrics play a crucial role in measuring and evaluating various aspects of a business or organization. Whether it’s in engineering, IT, or software development, metrics provide valuable insights into performance, efficiency, and overall success. In this ultimate guide, we will explore the concept of metrics, their importance, and the different types of metrics used in engineering, IT, and software development.

IT METRICS CATEGORIES


What do you mean by metrics?
Organizations use metrics as quantifiable measurements to track, analyze, and evaluate specific aspects of a process, system, or performance. Metrics offer objective data for assessing the effectiveness and efficiency of various activities within an organization. Monitoring progress, identifying areas for improvement, and making data-driven decisions are typical applications of metrics.
What are the 4 basic metrics?
In engineering, practitioners commonly use four basic metrics to measure performance and efficiency, known as DORA metrics. DORA stands for Deployment Frequency, Lead Time for Changes, Mean Time to Recover, and Change Failure Rate.
- Deployment Frequency measures how often code changes are deployed to production. A high deployment frequency indicates a fast and efficient development process.
- Lead Time for Changes measures the time it takes for a code change to go from development to production. A shorter lead time indicates a streamlined and agile development process.
- Mean Time to Recover measures the average time it takes to recover from a system failure or incident. A shorter mean time to recover indicates a robust and resilient system.
- Change Failure Rate measures the percentage of code changes that result in failures or incidents. A low change failure rate indicates a stable and reliable system.
DORA METRICS SECTION


VELOCITY METRICS SECTION
RESOURCES ALLOCATION METRICS SECTION
BEST PRACTICES SECTION
PERFORMANCE METRICS SECTION
PERFORMANCE METRICS SECTION
Importance of metrics in engineering
In engineering, objective data provided by metrics plays a crucial role in measuring and improving performance, efficiency, and quality. By monitoring and analyzing them, engineering teams can identify bottlenecks, inefficiencies, and areas for improvement. Metrics also provide a basis for setting goals, tracking progress, and making data-driven decisions.
In addition, metrics help in validating the effectiveness of process changes or improvements. They provide evidence of success or failure, allowing teams to iterate and optimize their engineering practices. They also facilitate communication and collaboration among team members, stakeholders, and management, by providing a common language and objective basis for discussions.
Best engineering support metrics
When it comes to engineering support, there are several key metrics that can help measure and improve the quality of support provided. These metrics include First Response Time, Average Resolution Time, Customer Satisfaction Score, and Escalation Rate.
- First Response Time measures the time it takes for a support team to respond to a customer’s request or inquiry. A shorter first response time indicates a prompt and efficient support team.
- Average Resolution Time measures the time it takes for a support team to resolve a customer’s issue. A shorter average resolution time indicates a knowledgeable and effective support team.
- Customer Satisfaction Score is a metric that gauges customers’ satisfaction levels with the support they receive, typically measured through surveys or feedback forms.
- Escalation Rate measures the percentage of support tickets that require escalation to higher-level support or management, with a low escalation rate indicating a capable and empowered support team.
Engineering metrics to watch on dashboard
In addition to the previously mentioned basic and support metrics, various other engineering metrics play a crucial role in offering valuable insights when integrated into a monitoring dashboard. These metrics encompass factors such as Code Coverage, which gauges the percentage of code covered by automated tests, signaling a comprehensive and well-tested codebase.
Another significant metric is Test Case Pass Rate, measuring the percentage of test cases that successfully pass and reflecting the stability and reliability of the system. Bug Density, indicating the number of bugs or defects per line of code, serves as a key metric for assessing the quality of the codebase, with lower bug density correlating to higher quality. Furthermore, Technical Debt quantifies the additional work or refactoring needed to enhance the codebase’s quality, with a higher technical debt implying an elevated risk of issues or failures.
What are the metrics of system engineering?
In system engineering, there are several metrics that are commonly used to measure and evaluate system performance, reliability, and scalability. These metrics include Availability, Mean Time Between Failures, Mean Time to Repair, and Scalability.
- Availability measures the percentage of time a system is operational and accessible to users. A higher availability indicates a more reliable and robust system.
- Mean Time Between Failures measures the average time between system failures. A longer mean time between failures indicates a more stable and resilient system.
- Mean Time to Repair measures the average time it takes to repair a failed system or component. A shorter mean time to repair indicates a faster recovery and less downtime.
- Scalability measures the ability of a system to handle increasing workload or user demand. It is typically measured in terms of response time or throughput.

Branch metrics
Branch metrics play a crucial role in software development, providing specific measurements to assess the health and effectiveness of code branches or feature branches. These metrics encompass Branch Coverage, which evaluates the percentage of code branches covered by automated tests, signifying a more comprehensive and well-tested codebase with higher branch coverage. Additionally, Code Complexity measures the intricacy of code branches using metrics such as cyclomatic complexity or code churn. A lower code complexity is indicative of a more maintainable and understandable codebase. Furthermore, Code Review Turnaround Time measures the time it takes to complete code reviews, with a shorter turnaround time reflecting a more efficient and collaborative development process.
Data metrics
Data metrics serve as critical tools to gauge and assess the quality, accuracy, and reliability of data within software applications or databases. Within this realm, metrics such as Data Integrity play a vital role in measuring the accuracy and consistency of data, preventing unauthorized corruption or modifications. Similarly, Data Consistency evaluates the coherence of data across diverse sources or systems, ensuring synchronization and accuracy throughout various applications or databases.
Data Completeness highlights the extent to which all required data fields or attributes are populated, indicating a more reliable and comprehensive dataset with higher data completeness. Furthermore, Data Accuracy plays a crucial role in examining the degree to which data values or attributes accurately reflect true information, thereby ensuring the reliability and trustworthiness of data for analysis or decision-making.
Types of metrics in software development
In software development, various types of metrics can measure and evaluate different aspects of the development process. These metrics include:
- Process Metrics measure the efficiency and effectiveness of the development process itself. These include Lead Time, Cycle Time, and Throughput.
- Product Metrics measure the quality, reliability, and maintainability of the software product. These include Defect Density, Code Coverage, and Customer Satisfaction.
- People Metrics measure the performance, productivity, and satisfaction of the development team. These include Team Velocity, Employee Satisfaction, and Employee Turnover.
Key performance indicators (KPIs) in engineering
Key Performance Indicators (KPIs) function as specific metrics crucial for measuring and evaluating the success and performance of distinct aspects within a business or organization. Within the engineering domain, various key performance indicators play a pivotal role in assessing the effectiveness and efficiency of engineering teams and processes. Among these KPIs are Time to Market, which measures the duration for the development and release of a product or feature, with a shorter time to market indicative of a faster and more efficient development process. Additionally, Customer Satisfaction measures the satisfaction level of customers with the products or services provided by the engineering team, typically gauged through surveys or feedback forms. Furthermore, Engineering Productivity serves as a KPI that measures the output and efficiency of the engineering team in terms of features developed, bugs fixed, or code refactored, offering insight into the team’s overall productivity and effectiveness.
Key business metrics for IT
In the field of IT, there are several key business metrics that can be used to measure and evaluate the success and performance of IT operations and services. These metrics include:
- IT Cost as a Percentage of Revenue measures the proportion of revenue spent on IT operations and services. This provides an indication of the efficiency and cost-effectiveness of IT operations.
- IT Budget Variance measures the difference between the planned IT budget and the actual expenditure. A lower budget variance indicates better budget management and control.
- IT Service Availability measures the percentage of time IT services are available and accessible to users. A higher service availability indicates a more reliable and robust IT infrastructure.
IT end user support metrics
IT end user support metrics play a crucial role in assessing the quality of the IT support provided to end users. They offer valuable insights into the overall performance of support teams. Among these metrics are First Call Resolution Rate, which measures the percentage of support requests or incidents resolved on the first interaction, serving as an indicator of a knowledgeable and efficient support team. Additionally, Average Response Time measures the average time taken for a support team to respond to user requests or issues, with a shorter average response time reflecting a prompt and responsive support team. Furthermore, User Satisfaction, measured through surveys or feedback forms, gauges the level of satisfaction among end users with the support received, providing a comprehensive understanding of the end user experience and satisfaction with IT support services.
IT performance management metrics
IT performance management metrics are essential tools used to measure and evaluate the effectiveness of IT operations and services. They provide a comprehensive overview of the overall health of an organization’s IT landscape. Among them, IT Service Level Agreement (SLA) Compliance stands out as a crucial indicator, measuring the extent to which IT services align with agreed-upon service level agreements with users or stakeholders. A higher SLA compliance reflects a reliable and responsive IT service.
Mean Time to Repair is instrumental in assessing the average time taken to rectify a failed IT system or service. A shorter mean time to repair signifies faster recovery and minimized downtime, contributing to enhanced operational efficiency. Furthermore, IT Incident Volume measures the frequency of IT incidents or service disruptions over a specific period, with a lower incident volume indicating a more stable and reliable IT infrastructure. Together, these metrics provide a comprehensive framework for evaluating and optimizing IT performance within an organization.
Setting measurable goals
Establishing measurable goals for metrics is crucial to actively utilize metrics for performance evaluation and improvement. Transitioning to the goal-setting process, it becomes imperative to ensure that goals adhere to the principles of being specific, measurable, achievable, relevant, and time-bound (SMART goals).
Specific goals bring clarity and focus to what needs to be achieved, while measurable goals enable quantification and tracking using metrics. Ensuring goals are achievable underscores their realism and attainability within given resources and constraints. Moreover, relevant goals align with the overall objectives and priorities of the organization, while time-bound goals set specific timeframes or deadlines for achievement.
By actively setting measurable goals, organizations can systematically track progress.
How to collect and analyze them
Organizations must actively collect and analyze metrics data to derive meaningful insights and make informed, data-driven decisions. To gather metrics data, organizations can utilize various sources such as monitoring tools, logging systems, databases, and user feedback.
After collecting the data, analysts need to actively analyze it to identify trends, patterns, and correlations. This analysis aids in understanding the current state, pinpointing areas for improvement, and facilitating informed decision-making. Establishing a standardized process for collecting, storing, and analyzing metrics data is crucial to ensuring consistency, accuracy, and reliability.
Some Tools and software for tracking
There are several tools and software available that can help organizations track and monitor metrics effectively. These tools provide features for data collection, visualization, analysis, and reporting.
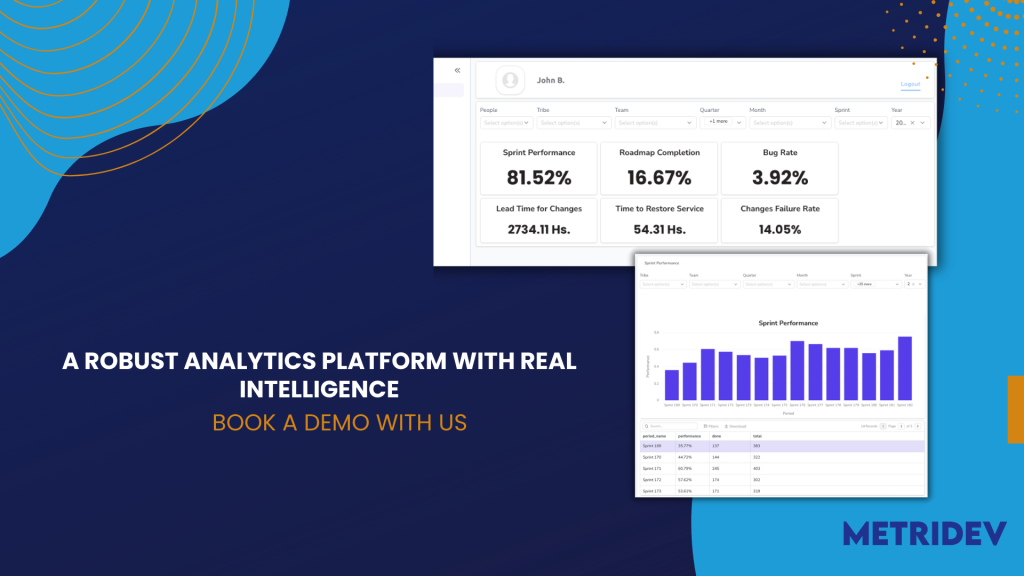
- Metridev is a analytics plataform that provide real intelligence for data-driven engineering teams. It analyze metrics to understand where engineering effort is being spent and to improve planning and forecasting.
- Google Analytics is a web analytics tool that tracks and analyzes website traffic and user behavior. It provides insights into metrics such as page views, bounce rate, and conversion rate.
By leveraging these tools and software, organizations can effectively track, analyze, and utilize metrics data.
Metrics Meaning in Business
In the realm of business, stakeholders use quantifiable measurements, known as metrics, to assess various aspects of performance and success. They provide a clear picture of how well a company is achieving its goals and objectives. Metrics in business can range from financial indicators such as revenue and profit margins to operational metrics like customer satisfaction and employee productivity.
For instance, a retail business may use metrics such as sales per square foot, customer retention rate, and inventory turnover to gauge its overall performance. These metrics help identify areas of improvement, optimize processes, and make informed decisions to drive growth and success.
Performance Metrics
Performance metrics are a subset of metrics that focus specifically on evaluating the performance of individuals, teams, or entire organizations. They serve as benchmarks to measure progress and identify areas of improvement. Common performance metrics include key performance indicators (KPIs), which are quantifiable goals that align with strategic objectives.
For example, a software development team may track metrics such as lines of code written, bugs fixed, and project completion time to assess the efficiency and productivity of their work. They offer insights into the team’s performance and facilitate the identification of bottlenecks or areas requiring additional resources.
Software Engineering Metrics
In the field of software engineering, metrics are essential for monitoring and improving the development process. Software engineering metrics can measure various aspects, including code quality, software complexity, and the effectiveness of development methodologies.
One widely used software engineering metric is the cyclomatic complexity, which measures the complexity of a software program by counting the number of linearly independent paths through its source code. This metric helps identify areas of code that may be prone to errors or difficult to maintain.
Another important metric in software engineering is the defect density, which measures the number of defects per unit of code. This metric provides insights into the quality of the software and helps prioritize bug fixes and improvements.
What is Process Metrics in Software Engineering?
Process metrics in software engineering focus on evaluating the effectiveness and efficiency of the development process itself. These metrics provide insights into the performance of the development team and help identify areas for improvement.
Lead time is an example of a process metric, which measures the time taken from the initiation of a development task to its completion. This metric helps teams identify bottlenecks and optimize their workflow to reduce lead times and improve overall efficiency.
Defect arrival rate is another process metric, which measures the rate at which defects are discovered during the development process. This metric helps identify trends and patterns in defect discovery, allowing teams to address underlying issues and improve the quality of their software.
Software Engineering Manager Jira Metrics
Jira is a popular project management tool used by software engineering teams to track and manage their work. Jira provides various built-in metrics and reporting features that help software engineering managers monitor team performance and make data-driven decisions.
Some of the key metrics in Jira are cycle time, which measures the time taken to complete a work item from start to finish. This metric helps managers identify bottlenecks and optimize the team’s workflow to ensure timely delivery of projects. And average age of unresolved issues, which measures the average time unresolved issues have been open. This metric helps managers identify issues that may require immediate attention and allocate resources accordingly.

Metrics for Agile Development Projects
Agile development methodologies have gained popularity in recent years due to their flexibility and efficiency. Metrics play a crucial role in agile projects by providing feedback and insights into the development process.
One commonly used metric in agile development is the velocity, which measures the amount of work completed by a team in a given time period. Velocity helps teams estimate the time and effort required to complete future tasks and plan their work accordingly. Burn-down chart is also an important metric in agile, it visualizes the remaining work over time. This metric helps teams track their progress and identify any deviations from the planned schedule.
Quality Metrics in Software Engineering Template
Ensuring the quality of software is paramount in software engineering. Quality metrics provide valuable insights into the effectiveness of quality assurance processes and help identify areas for improvement.
One commonly used quality metric is the defect removal efficiency (DRE), which measures the effectiveness of defect detection and removal activities. DRE is calculated by dividing the number of defects found before release by the total number of defects found before and after release.
Another quality metric is the customer satisfaction index (CSI), which measures the level of customer satisfaction with the software product. CSI is usually obtained through surveys or feedback mechanisms and helps teams gauge the overall quality of their software from the user’s perspective.
Metrics for Application Development
Metrics are essential in application development to ensure the quality and effectiveness of the software being developed. These metrics help teams assess the performance and impact of their applications.
User satisfaction score is an important metric in application development, which measures the level of satisfaction users have with the application. This metric is usually obtained through surveys or feedback mechanisms and helps teams understand user needs and make improvements accordingly. Another critical metric is the response time, which measures the time taken for an application to respond to user requests. This metric helps teams identify performance issues and optimize the application for better user experience.
Best Practices for Analyzing and Interpreting them
Analyzing and interpreting metrics effectively is crucial for deriving meaningful insights and making informed decisions. Here are some best practices to consider:
1. Define clear objectives: Before analyzing metrics, clearly define what you want to achieve and which metrics are relevant to your goals. This ensures a focused analysis and avoids getting overwhelmed with irrelevant data.
2. Compare against benchmarks: To understand the significance of your metrics, compare them against industry benchmarks or your own historical data. This provides insights into how well you are performing compared to others or your previous performance.
3. Look for trends and patterns: Analyze metrics over time to identify trends and patterns. This helps uncover underlying issues or opportunities for improvement that may not be apparent from individual data points.
4. Consider the context: When interpreting metrics, consider the context in which they were measured. External factors such as seasonality or market conditions can influence the results and should be taken into account.
5. Communicate and collaborate: Metrics analysis should not be done in isolation. Share your findings with relevant stakeholders and collaborate on interpreting the data. This fosters a shared understanding and enables collective decision-making.
SDLC Metrics
Metrics play a crucial role at every stage of the software development life cycle (SDLC). They offer valuable insights into the efficiency of each phase and aiding in the identification of areas for improvement.
In the requirements gathering phase, one can utilize metrics such as requirement volatility and completeness to evaluate the stability and comprehensiveness of the requirements. Throughout the development phase, tracking metrics like code quality and maintainability ensures that the software attains high quality and remains easily maintainable. In the testing phase, metrics such as defect density and test coverage provide a means to assess the effectiveness of testing efforts and identify potential gaps in test coverage. Finally, in the deployment and maintenance phases, measuring metrics like uptime and customer satisfaction is essential to guarantee the smooth operation of the software and its alignment with user expectations.
Decision Making
Metrics-driven decision making involves using data and metrics to inform and guide decision-making processes. By basing decisions on objective measurements rather than subjective opinions, organizations can make more informed and effective choices.
Metrics-driven decision making can be applied to various aspects of business and technology. For example, in project management, metrics can help identify risks and make decisions that mitigate those risks. In marketing, metrics can guide campaign strategies and optimize marketing spend.
To implement metrics-driven decision making, organizations should establish clear metrics and data collection processes, ensure data quality and accuracy, and train employees on how to interpret and use the data effectively.

Business Development Metrics Examples
Business development metrics are used to evaluate the success and effectiveness of business development strategies and initiatives. These metrics help identify areas for growth and guide decision making to drive business expansion. Examples of business development metrics include:
- The revenue growth rate measures the percentage increase in revenue over a specific period. This metric helps organizations assess their ability to generate new business and increase market share.
- Customer acquisition cost measures the cost incurred to acquire a new customer. This metric helps organizations evaluate the efficiency of their sales and marketing efforts and optimize their customer acquisition strategies.
- Sales pipeline conversion rate measures the percentage of leads that successfully convert into paying customers. This metric helps organizations identify bottlenecks in their sales process and improve their conversion rates.
Conclusion
Metrics play a critical role in business and technology, providing valuable insights into performance, quality, and effectiveness. As organizations continue to rely on data-driven decision making, the importance of metrics will only grow.
In the future, we can expect to see advancements in metrics collection and analysis, driven by advancements in technology and data analytics. Organizations will have access to more granular and real-time metrics, allowing for more accurate and timely decision making.
However, it is important to remember that metrics are just one piece of the puzzle. They should be used in conjunction with qualitative data and human judgment to make well-rounded and informed decisions.
As we navigate the ever-evolving landscape of business and technology, metrics will continue to be a valuable tool for organizations to assess, improve, and drive success.
To learn more about leveraging metrics in your business or software engineering projects, read our articles about Quality Metrics and Velocity Metrics.