
Introduction
As a CTO, you are responsible for overseeing the technological aspects of your organization. You need to stay on top of various metrics and data points to ensure the smooth functioning of your tech operations. A CTO dashboard is a powerful tool that provides you with a centralized view of all the relevant information in one place. It acts as a control center, giving you instant access to critical data and metrics.

What is a CTO Dashboard?
A CTO dashboard is a visual representation of key metrics and performance indicators that are relevant to your role as a tech leader. It consolidates data from different sources and presents it in an easy-to-understand format. The dashboard can be customized to display the specific metrics that matter most to you and your organization. It provides real-time updates and allows you to drill down into the details for deeper analysis.
Importance of CTO Dashboard for Tech Leaders
Having a CTO dashboard is crucial for tech leaders for several reasons. Firstly, it provides you with a holistic view of your organization’s technology performance. You can track metrics such as uptime, response time, and system availability to ensure that your tech infrastructure is functioning optimally. This helps in identifying potential issues before they become major problems.
Secondly, a CTO dashboard enables you to monitor the progress of key projects and initiatives. You can track milestones, resource allocation, and project timelines to ensure that everything is on track. This helps in identifying bottlenecks and allocating resources more efficiently.
Lastly, a CTO dashboard allows you to align your tech strategy with your business goals. By tracking metrics related to revenue, customer satisfaction, and market share, you can make data-driven decisions that have a direct impact on your organization’s bottom line.
Key Metrics to Track on CTO Dashboard
When it comes to tracking metrics on your CTO dashboard, it is essential to focus on those that are most relevant to your organization’s goals and objectives. While the specific metrics may vary depending on your industry and business model, here are some key metrics that are commonly tracked by tech leaders:
1. Uptime and Availability: This metric measures the percentage of time your systems are up and running. It helps in assessing the reliability and stability of your tech infrastructure.
2. Response Time: The response time metric measures how quickly your systems respond to user requests. It is crucial for delivering a seamless user experience.
3. System Performance: This metric tracks the overall performance of your systems, including CPU usage, memory utilization, and network latency. It helps in identifying performance bottlenecks and optimizing system resources.
4. Bug/Error Rates: Tracking the number of bugs and errors in your software is essential for ensuring the quality of your products. Lower bug/error rates indicate better software reliability.
5. Security Metrics: Security is a top concern for tech leaders. Tracking metrics such as number of security incidents, vulnerability patching, and compliance status helps in ensuring the security of your organization’s data and systems.
How CTO Dashboard Improves Decision Making
A CTO dashboard plays a crucial role in enhancing decision-making for tech leaders by offering real-time and actionable insights. It achieves this by presenting complex data in visually appealing formats, such as charts, graphs, and heatmaps, facilitating the identification of trends, patterns, and anomalies. Unlike traditional reports and data analysis, a CTO dashboard provides immediate updates, ensuring access to the most recent information. Additionally, it offers drill-down capabilities, enabling a deeper dive into specific metrics or data points for more insightful decision-making. Furthermore, the dashboard aids in identifying improvement opportunities and optimizing processes by tracking key metrics. Lastly, it helps align tech strategies with organizational business goals by monitoring metrics directly impacting revenue, customer satisfaction, and market share, thereby contributing to the overall success of the organization.

CTO KPI Dashboard
A CTO KPI dashboard focuses on the key performance indicators that are directly linked to the CTO’s goals and objectives. These metrics provide insights into the effectiveness of the CTO’s strategies and initiatives. Here are some essential KPIs that can be tracked on a CTO dashboard:
- Engineering Velocity: This metric measures the speed and efficiency of the engineering team in delivering projects. It includes metrics like cycle time, lead time, and backlog size. Tracking engineering velocity on the CTO dashboard helps identify bottlenecks in the development process and enables CTOs to implement strategies for continuous improvement.
- Infrastructure Cost: Managing infrastructure costs is a critical responsibility of a CTO. The CTO dashboard can track metrics related to infrastructure spending, such as cloud service costs, equipment maintenance expenses, and energy consumption. Monitoring these metrics helps CTOs optimize costs and allocate resources efficiently.
- Customer Satisfaction: Ultimately, the success of any technical operation depends on customer satisfaction. The CTO dashboard can include metrics related to customer feedback, support response time, and product performance. By tracking customer satisfaction metrics, CTOs can identify areas for improvement and prioritize initiatives that enhance the customer experience.
Implementing a CTO Dashboard in Your Organization
Implementing a CTO dashboard in your organization requires careful planning and execution. Here are some steps to consider:
1. Identify Key Metrics: Determine the key metrics that are most relevant to your organization’s goals and objectives. Consult with other stakeholders, such as the CEO and other department heads, to ensure alignment.
2. Choose the Right Software: There are several software options available in the market. Evaluate different tools based on your requirements, budget, and scalability. Consider factors such as ease of use, customization options, and integration capabilities.
3. Data Integration: Ensure that your CTO dashboard integrates seamlessly with your existing tech infrastructure. It should be able to pull data from various sources, such as monitoring tools, databases, and APIs.
4. Customization: Customize your CTO dashboard to display the specific metrics and visualizations that matter most to you. Ensure that the dashboard is user-friendly and provides an intuitive interface for easy navigation.
5. Training and Adoption: Provide training and resources to your team members to ensure smooth adoption of the CTO dashboard. Encourage them to use the dashboard regularly and provide feedback for continuous improvement.
Common Challenges and Solutions in Using a CTO Dashboard
While implementing and utilizing a CTO dashboard offers numerous benefits, tech leaders may encounter common challenges in the process. One significant challenge is maintaining data quality and accuracy, which is crucial for informed decision-making. To address this, it’s essential to establish robust data governance processes and validate data inputs to uphold data integrity.
Another potential issue is data overload, where the abundance of information on the CTO dashboard can be overwhelming. To mitigate this, it’s important to focus on the most critical metrics and avoid cluttering the dashboard with unnecessary information. Resistance to change is also a common challenge, as some team members may be hesitant to adopt the CTO dashboard due to change management issues. To overcome this hurdle, effective communication of the dashboard’s benefits is crucial. Additionally, providing training and support can address concerns and facilitate a smoother transition. Integration challenges pose another obstacle, particularly when integrating the CTO dashboard with existing systems and tools. To navigate this, close collaboration with the IT team and software vendors is essential to ensure a seamless integration process.
What is the CTO Tool?
The CTO tool is a software solution designed specifically for CTOs to streamline their workflows and enhance productivity. It integrates with various systems and databases to collect and analyze data, providing CTOs with actionable insights. The CTO tool typically includes features like customizable dashboards, data visualization, trend analysis, and collaboration capabilities.
The CTO tool acts as a centralized hub, enabling CTOs to monitor key metrics, track progress towards goals, and collaborate with other stakeholders. It eliminates the need for manual data collection and analysis, saving valuable time and resources. By leveraging the power of technology, CTOs can focus on strategic decision making and drive innovation within their organizations.

Best Practices for Utilizing a CTO Dashboard
To maximize the benefits of a CTO dashboard, here are some best practices to follow:
1. Define Clear Objectives: Clearly define the objectives and goals that you want to achieve with your CTO dashboard. This will help in choosing the right metrics and visualizations.
2. Regular Monitoring and Analysis: Regularly monitor and analyze the metrics on your CTO dashboard. Set up alerts and notifications for critical thresholds to ensure timely action.
3. Collaboration and Communication: Use the CTO dashboard as a communication tool to share insights and updates with other stakeholders. Collaborate with other department heads to align tech initiatives with broader business goals.
4. Continuous Improvement: Regularly review and update your CTO dashboard based on feedback and changing requirements. Continuously strive to optimize and enhance the dashboard’s capabilities.
What is a CTO Report?
In addition to the CTO dashboard, a CTO report is another valuable tool for tech leaders. A CTO report provides a comprehensive overview of the organization’s technology performance, projects, and initiatives. It includes in-depth analysis, recommendations, and future plans. The CTO report complements the CTO dashboard by providing a more detailed and strategic perspective.
CTO Dashboard Software Options
When it comes to choosing a CTO dashboard software, there are several options available in the market. Some popular software options include:
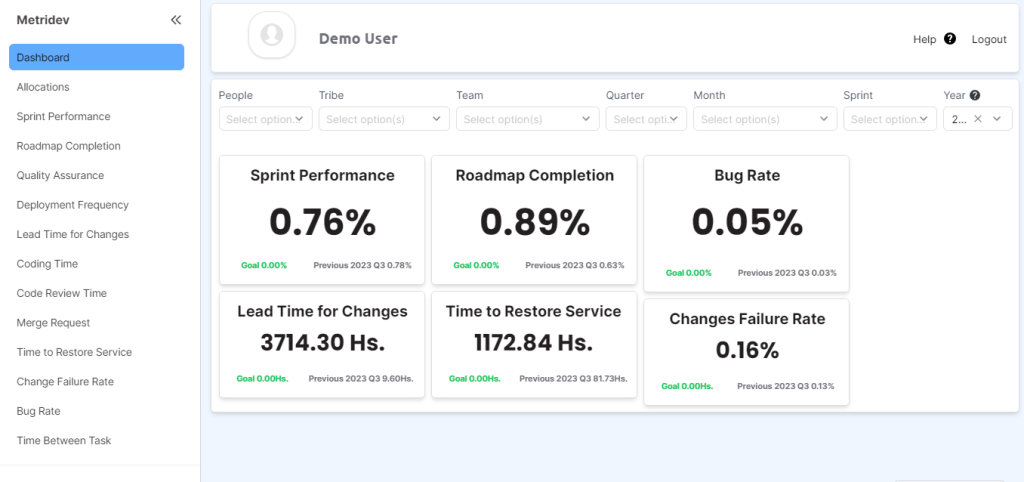
- Metridev: Metridev is a SaaS for tech companies to improve their engineering workflow and maximize the business impact of engineering.
- Power BI: Power BI is a business analytics tool by Microsoft. It provides a user-friendly interface for creating visually compelling dashboards and reports. It integrates well with other Microsoft products.
- Tableau: Tableau is a powerful data visualization tool that allows you to create interactive and dynamic dashboards. It offers a wide range of visualizations and integration capabilities.
Training and Resources for CTO Dashboard Implementation
Successfully setting up a CTO dashboard requires the right training and resources. Consider vendor training as one option, where CTO dashboard software providers often offer programs and resources to help you start smoothly. It’s crucial to use these resources to get familiar with the software.
Online courses are another helpful choice. Platforms like Udemy and Coursera have various courses and tutorials covering CTO dashboards, touching on topics like data visualization, business intelligence, and dashboard design. Going to industry conferences and events focused on data analytics and business intelligence is also a good idea. These gatherings not only give valuable insights but also provide networking opportunities, helping professionals stay updated on the latest trends and best practices.
Moreover, it’s essential to encourage internal training and knowledge sharing within the organization. By holding internal training sessions and workshops, you can educate team members about the CTO dashboard and explain its benefits. This collaborative approach improves overall understanding and use of the dashboard within the organization.
Conclusion
In conclusion, a CTO dashboard is a game-changer for tech leaders. It provides real-time insights, helps in data-driven decision making, and aligns tech strategy with business goals. By tracking key metrics and visualizing data in an easy to-understand format, a CTO dashboard empowers tech leaders to make informed decisions that drive organizational success. Implementing a CTO dashboard requires careful planning, choosing the right software, and providing proper training and resources. By following best practices and continuously improving the dashboard, tech leaders can leverage its power to stay ahead in the fast-paced world of technology. Start implementing a CTO dashboard today and unlock the full potential of your tech operations.

Ready to take your tech leadership to the next level? Start implementing a in your organization and experience the game-changing benefits, read our article about Software Efficiency.
IT METRICS TO BECOME AN EXPERT